 |
ryan
中級會員
註冊日期: Feb 2020
來 自:
文章數量: 48 |
|
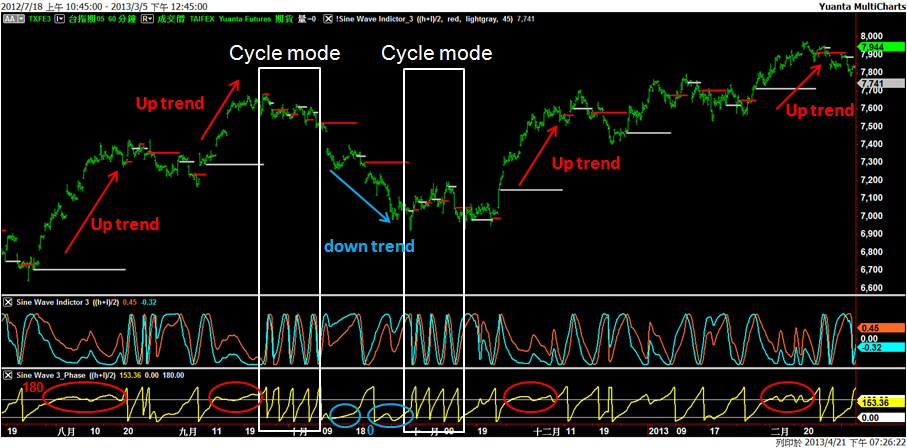
John F. Ehlers的Sinewave Indicator
請問版上的各位高手
John F. Ehlers的Sinewave Indicator
如何改為奇狐指標
http://quantitative-tradingg.blogsp...-indicator.html
介紹的很詳細 也有原碼:
Inputs: Price((H+L)/2);
Vars: Smooth (0),Detrender (0) , I1 (0), Q1 (0), jI (0), JQ (0), I2 (0), Q2 (0), Re (0), Im (0), Period (0), SmoothPeriod (0), SmoothPrice (0), DCPeriod (0), RealPart (0),
Imagpart (0), count (0), DCPhase (0), DCSine (0), LeadSine (0), Itrend (0), Trendline (0),
Trend (0), DaysinTrend (0);
If CurrentBar > 5 then begin
Smooth = (4*Price + 3*Price[1] + 2*Price[2] + Price[3]) / 10;
Detrender = (.0962 * Smooth + .5769 * Smooth[2] - .5769 * Smooth[4] - .0962*Smooth[6]) * (.075 * Period[1] + .54);
{Compute InPhase and Quadrature components.}
Q1 = (.0962 * Detrender + .5769 * Detrender[2] - .5769 * Detrender[4] - .0962 * Detrender[6]) * (.075 * Period[1] + .54);
I1 = Detrender[3];
{Advance the phase of I1 and Q1 by 90 degrees}
jI = (.0962 * I1 + .5769 * I1[2] - .5769 * I1[4] - .0962 * I1[6]) * (.075 * Period[1] + .54);
JQ = (.0962 * Q1 + .5769 * Q1[2] - .5769 * Q1[4] - .0962 * Q1[6]) * (.075 * Period[1] + .54);
{Phasor addition for 3 bar averaging)}
I2 = I1 - JQ;
Q2 = Q1 + jI;
{Smooth the I and Q components before applying the discriminator}
I2 = .2 * I2 + .8 * I2[1];
Q2 = .2 * Q2 + .8 * Q2[1];
{Homodyne Discriminator}
Re = I2 * I2[1] + Q2 * Q2[1];
Im = I2 * Q2[1] - Q2 * I2[1];
Re = .2 * Re + .8 * Re[1];
Im = .2 * Im + .8 * Im[1];
If Im <> 0 and Re <> 0 then Period = 360 / ArcTangent (Im/Re);
If Period > 1.5 * Period[1] then Period = 1.5 * Period[1];
If Period < .67 * Period[1] then Period = .67 * Period[1];
If Period < 6 then Period = 6;
If Period > 50 then Period = 50;
Period = .2 * Period + .8 * Period[1];
SmoothPeriod = .33 * Period + .67 * SmoothPeriod[1];
{Compute Dominant Cycle Phase}
SmoothPrice = (4 * price + 3 * Price[1] + 2 * Price[2] + Price[3]) / 10;
DCPeriod = IntPortion(SmoothPeriod + .5);
RealPart = 0;
ImagPart = 0;
For count = 0 To DCPeriod - 1 begin
RealPart = RealPart + sine (360 * count / DCPeriod) *
(SmoothPrice[count]);
ImagPart = imagPart + CoSine (360 * count / DCPeriod) *
(SmoothPrice[count]);
End;
If AbsValue(ImagPart) > 0
then DCPhase = Arctangent(RealPart / ImagPart);
If AbsValue(ImagPart) <= .001
then DCPhase = DCPhase + 90 * Sign(RealPart);
DCPhase = DCPhase + 90;
{Compensate for one bar lag of the Weighted Moving Average}
DCPhase = DCPhase + 360 / SmoothPeriod;
If ImagPart < 0 then DCPhase = DCPhase + 180;
If DCPhase > 315 then DCPhase = DCPhase - 360;
Plot1(Sine(DCPhase), "Sine");
Plot2(Sine(DCPhase + 45), "LeadSine");
end;
|
|
向版主報告此篇 |  |
|
 2020-02-10 12:32
 |
|
|
| |
|
ryan
中級會員
註冊日期: Feb 2020
來 自:
文章數量: 48 |
|
回覆
這個是2014至2016的網頁
連結進去已經沒有新的貼文了
所以沒有新的貼圖
Plot1(Sine(DCPhase), "Sine");
Plot2(Sine(DCPhase + 45), "LeadSine");
應該是上面的指標
下面的應該是回答留言所指的
Plot1(DCPhase, "DCPhase");
Plot2(0, "0");
Plot3(180, "180");
|
|
向版主報告此篇 | |
|
|
2020-02-11 12:32 |
|
|
| |
|
ryan
中級會員
註冊日期: Feb 2020
來 自:
文章數量: 48 |
|
哇
如果紅藍線跟黃線分開為二個指標
就都一樣了
總版主真厲害
這個指標對於"盤整盤"跟"趨勢盤"的
判別有獨特的見解
總版主可以嘉惠我們狐友嗎
謝謝
|
|
向版主報告此篇 | |
|
|
2020-02-11 21:16 |
|
|
| |
|
cgjj
總版主

註冊日期: Oct 2003
來 自:
文章數量: 18190 |
|
此公式計算負荷較重,請謹慎設定參數!!! (計算的總K棒數)
使用時請注意 CPU 負載,不要同時跑太多軟體或公式!
預設只算近期1200根K棒,請自行適度加減調整。
 附件: SINEWAVE.ALG 附件: SINEWAVE.ALG
此文件已被下載 304 次。
|
|
向版主報告此篇 | |
|
|
2020-02-12 09:24 |
|
|
| |
本站所有內容未經作者授權禁止轉貼節錄, 發表言論僅供參考勿作為投資決策依據。瀏覽本站請使用 IE 5.5 以上版本, 最佳瀏覽解析度 1024 x 768 全彩。
|
Powered by: vBulletin Version 2.3.0 - Copyright©2000-, Jelsoft Enterprises Limited.
簡愛洋行 製作 Copyright 2003-. All Rights Reserved. 聯絡我們
|


 )
)


